Demerit goods
A demerit good is a private good which, when consumed, generates less benefit to the community than is perceived by the consumer. In a free market economy it is assumed that individuals will make a decision regarding consumption based on their expected marginal benefit. However, consumption of a demerit good creates a negative impact on others, and reduces the net value of any benefit.
Without intervention, individual decisions are distorted as a result of failing to take into account the resulting loss of benefit to society - this loss is either not understood at all, or only partially understood. Hence, there is likely to be an 'over-consumption' of demerit goods. The impact is referred to as a negative consumption externality. [This loss is shown as reducing the 'net benefit' to society of consuming, and is not shown as a production externality.)1.
Example
If we take the example of alcohol, it is clear that, while a consumer is likely to believe they are gaining a specific benefit from consumption, if only in the short term, they may not include the fact that drinking alcohol can have negative consequences to themselves and third-parties when they decide on their own level of consumption.
Consuming alcohol can create the following consumption externalities:
- Increased 'physical' health issues, leading to lost days at work and lost output
- Increased 'mental' health issues, leading to withdrawal from work and, again, lost output
- Health issues that require medical treatment that may be funded by others
- Accidents while driving which impact on others in terms of physical harm and damage to vehicles and property
Diagram for demerit goods
The diagram for demerit goods starts by assuming that the market demand for a given good, say bottles of wine, reflects the expected marginal benefit (or utility) from consumption - hence the marginal private benefit curve can be considered as the demand curve for wine, shown as MPB below. Given that the demand for demerit goods in a free market is driven by self interest, there is a significant information failure regarding the extent of this benefit to the wider community. In this case, there is a negative externality from the consumption of a demerit good1.
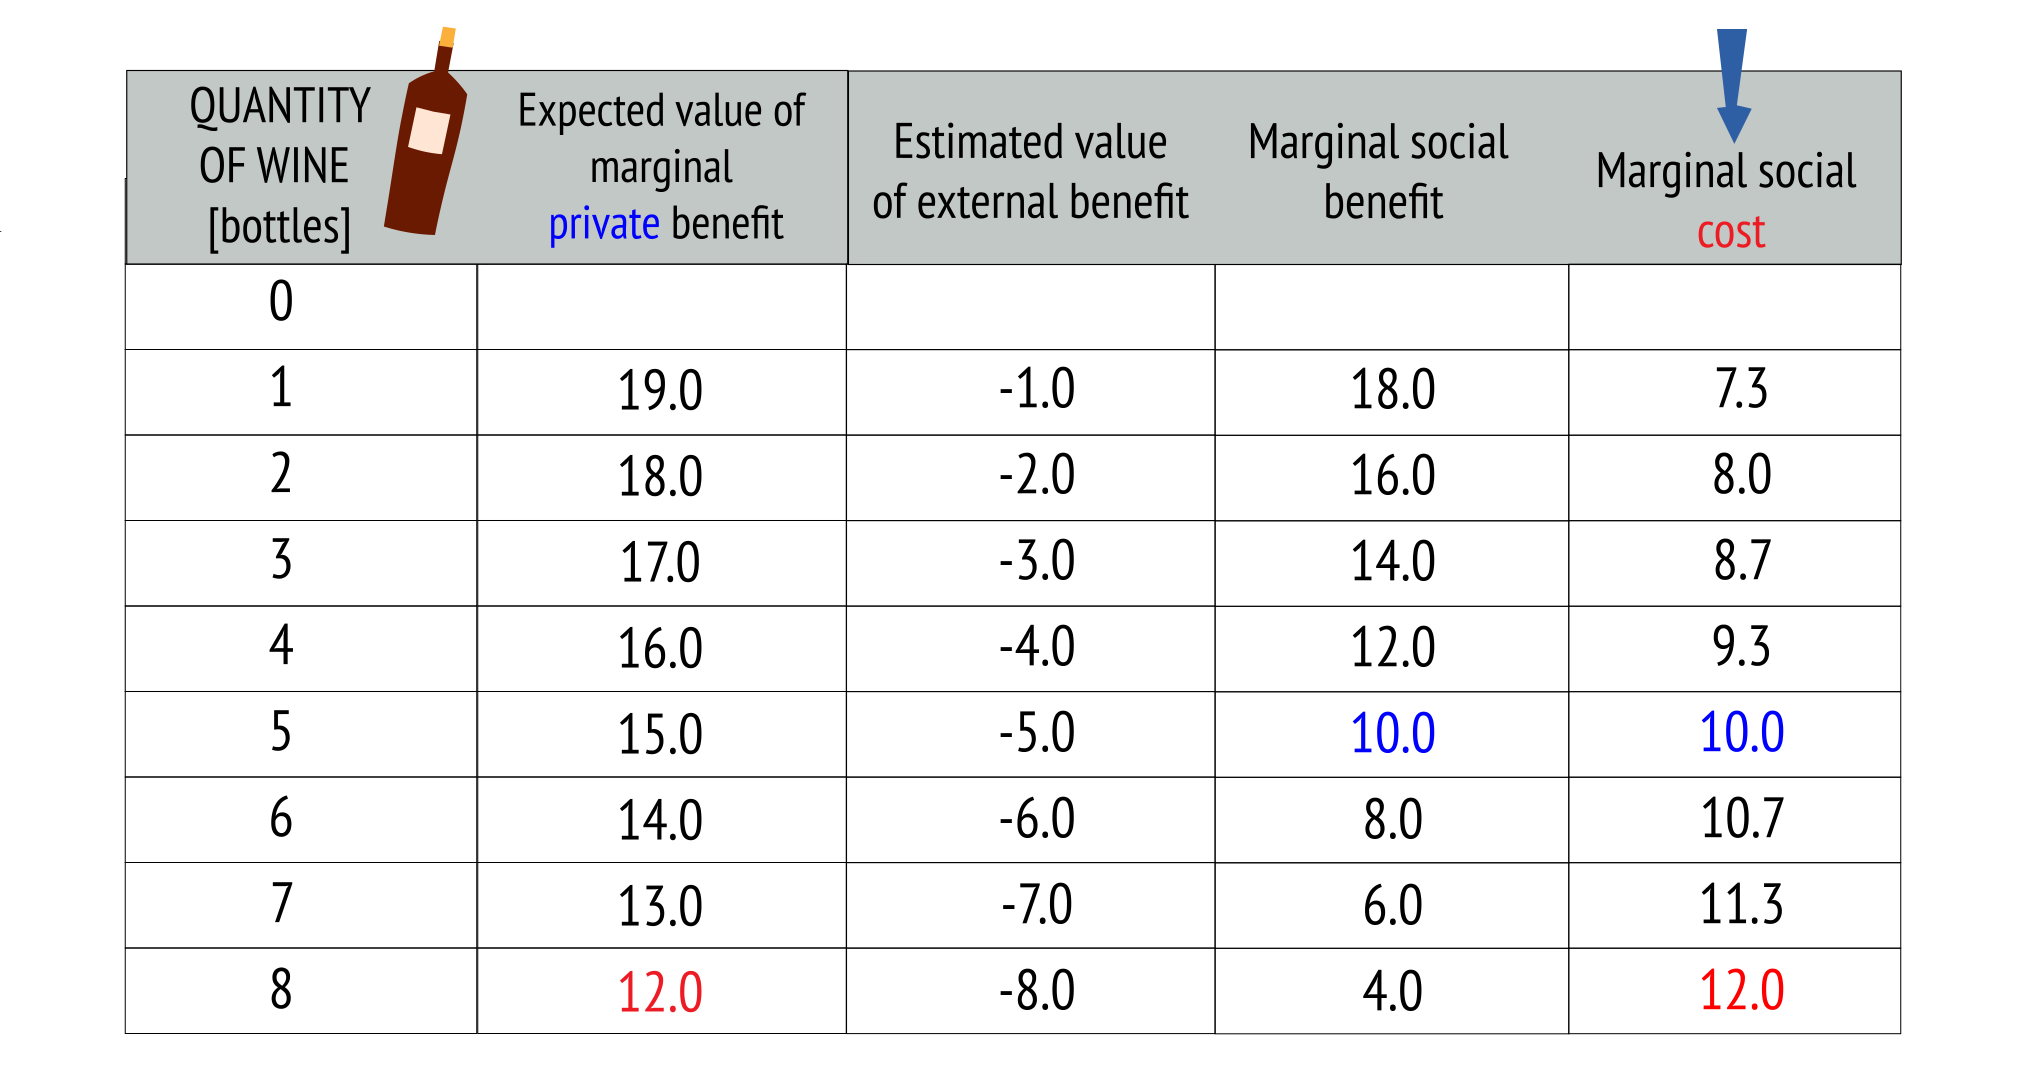
The schedule for wine

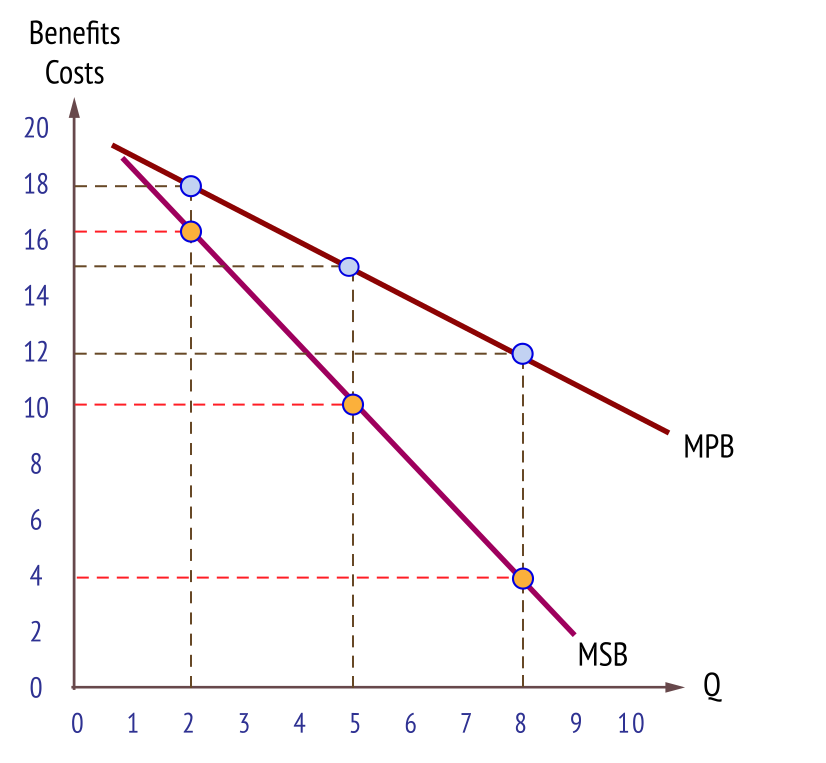
The schedule shows that the expected marginal private benefit declines with consumption. When we add in the effect of the negative consumption externality, the marginal social benefit is less than the marginal private benefit.
This is shown in the following diagram.
The diagram for wine
Adding in the marginal social cost
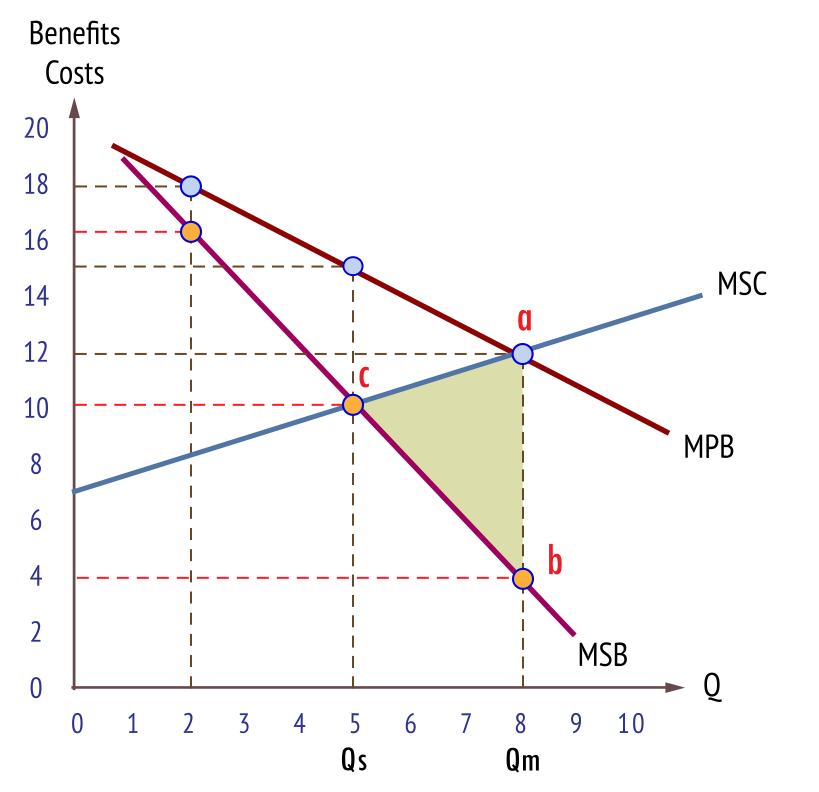
When the marginal social cost is added we can find compare the market allocation and the socially efficient allocation.
The diagram with costs and showing equilibrium

The market equilibrium will occur at the output which equates the expected marginal private benefit with the marginal private cost, which is at quantity Qm, at 8 units [bottles of wine2].
However, the socially efficient consumption is much lower, at 5 units, [Qs], where Marginal Social Benefit [MSB] equals Marginal Social Cost [MSC].
What is the welfare loss?
The welfare loss existing if the demerit good was supplied exclusively through the market would be the value of the 'excess' consumption - in this case, 3 units [from 8 to 5], which is shown as the shared area a, b, c.
It is assumed that there is no production externality, so that MSB = MPB. If the production of the demerit good also generates a negative external cost - such as chemical pollution - the socially efficient level of production would fall even further.
Remedies
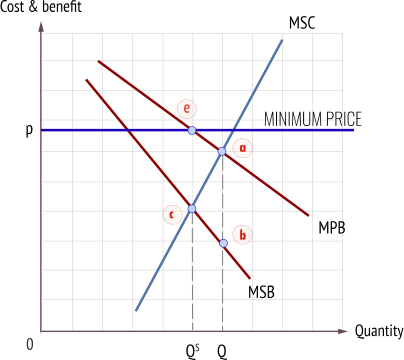
Several remedies exist to reduce the consumption of demerit goods, including taxation of demerit goods, and imposing minimum prices.
The effect of a tax is to internalise the externality, so that consumers (and producers) bear some of the externality. Demand contracts from a to e, and the socially efficient output at Qs can be established.

A minimum price can also be imposed, which forces sellers and retailers to charge this price (at least). Again, demand contracts and the socially efficient output is established.
In both cases there is the criticism that government intervention might not achieve the socially optimal solution.
Information failure can distort the decision making process so that imposing a special alcohol tax of 20%, for example, might not be sufficient, or it may prove excessive. Also, the law of unintended consequences may weaken the overall effectiveness of the intervention - for example, taxes may drive consumption into the 'hidden' or 'shadow' economy, with little effect on total consumption, but resulting in a fall in government tax revenue.
1. It should be noted that the impact of a demerit good is best explained through the adjustment of the social benefit curve, rather than the social cost curve. However, it is possible to illustrate the impact of a demerit good by altering the Marginal Social Cost curve (which would be to the left of the Marginal Private Cost curve). The result is the same, with the Socially Efficient level of consumption lower than the Market level. Some examination boards prefer to show it this way.
2. In this simple example, the units consumed are shown as single units - in a real market the units would be expressed in thousands or millions!


