Consumer and producer surplus
Consumer and producer surplus are key concepts used in the evaluation of markets and changes in market conditions.
Whenever markets establish a price, economists can assess the benefit to consumers and producers of that particular price. The benefit to consumers and producers can be assessed by considering the 'surplus' gained during a transaction.
Consumer surplus
From the consumer's point of view this surplus can be considered in terms of 'utility' and from the producer's perspective the benefit can be expressed in terms of 'profits'. Above a certain point, utility and profits are considered to be a 'surplus'.
Consumer surplus is the additional benefit to consumers that they derive when the price they pay in the market is less than the maximum they are prepared to pay.
Consumer surplus is an important concept as it provides a method to evaluate the impact of changes in market conditions, and in terms of the impact of government policy, including the effects of taxation and subsidies.
A demand curve reflects the expected marginal benefit (or utility) derived by consumers when they purchase a given quantity. In the diagram below, the consumer is prepared to pay Py for a single unit Qx given that the expected value of that unit is MU1. However, the actual market price is at P1 - hence there is an additional benefit to the consumer of consuming this single unit at P1 - rather than the higher price, Py. The extra benefit is the consumer surplus, which is shown as the grey shaded area.

As more is consumed, the marginal unitity falls (as a result of the principle of diminishing marginal utility), and the marginal consumer surplus diminishes. In a given market, and assuming consumption is at the equilibrium level, consumers collectively gain the whole area of consumer surplus, as shown.
Total consumer surplus is measured as the area from the price line up to the demand curve.

Consumer surplus and price changes
If price rises, there will be a negative income effect and substitution effect, resulting in reduced demand.
This means that, assuming a fixed budget, less can be purchased (the income effect), and assuming the price of substitutes remains constant, consumers will switch to the alternative (the substitution effect). The result is that consumer surplus falls.
Hence, the higher the price, the smaller the area for consumer surplus, and conversely, the lower the price the larger the area of consumer surplus.


Producer surplus
Producer surplus is the additional benefit derived by producers when the price they receive is more than the minimum they are prepared to receive.
If we assume that a producer wishes at the very least to cover their opportunity cost (so that they carry on in business) then any reward above this is the producer's surplus - it is equivalent to the idea of super-normal profits used in the 'theory of the firm'.
A supply curve reflects the expected private marginal costs incurred by producers when supplying goods and services.
Covering the marginal cost of production is essential for firms. If the firm produces Q1 units, the marginal cost is at ‘m’. However, if the market price is P, producer surplus of ‘m’ to ‘x’ is gained.

Graphically, producer surplus is the area from the supply curve to the price line. Producer surplus is gained whenever revenue exceeds the minimum necessary to cover marginal cost. The higher the price, the greater the area of producer surplus.
Changes in producer surplus
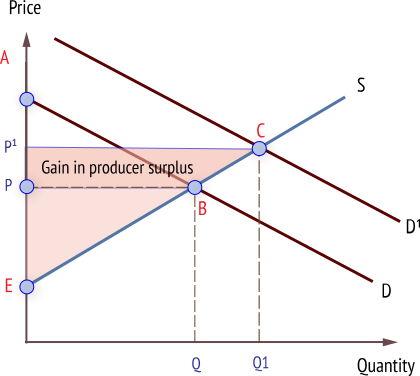
With a price increase (following an increase in demand) the area for producer surplus will also increase, from area P,B,E to area P1,C,E - an increase of area P1,B,C,P.